The Coalition victory on Saturday night was a shock for most people following the campaign closely. ‘Stunned’, ‘surprised’, ‘astonished’ seem to be the reactions around the country. It was definitely a bit of a shock to me. I tweeted on the morning of the election “Our forecast is more bearish on an ALP victory compared with the conventional wisdom. We’re a little nervous but we’ll see tonight 😬.” It looks like I should have had a bit more faith in the Buckley’s & None forecast.
The Buckley’s & None forecast is probabilistic. This means we try and estimate how likely different outcomes are, rather than just trying to find the most likely outcome. In particular, our forecast estimated the likelihood of three outcomes: the ALP winning, the Coalition winning, and a minority government where neither party wins the 76 seats needed to form majority government. Buckley’s & None isn’t trying to predict the exact number of seats each party will win on election night. Our aim is to paint a picture of the likelihood of the possible outcomes to give a data-driven idea of what could happen.
Our final forecast had the most likely result as a minority government with a 2 in 5 (40.0%) chance. Our least likely outcome was the Coalition winning at 1 in 4 (25.3%). Between these results was around a 1 in 3 (34.7%) chance of an ALP victory.
Polling throughout the election campaign had the national two-party preferred vote at ALP 51-52% and Coalition 49-48%. While there’s good evidence something funny was happening with the polls, and they were wrong (more on this in a future post), they were still consistently showing a close race. Our forecast is built on the accuracy of prior polling. It remembers that polling errors happen regularly, when it is easy for us mere mortals to forget. In this instance, the polling error seems to have occurred in the crucial spot that changes the result of an election.
It looks like the actual result is right on the edge between a Coalition win and a minority government. As I write this, the ABC has called 75 seats for the Coalition, 65 for the ALP, and 6 seats being held by crossbenchers. Five seats have not yet been called by the ABC election analyst Antony Green. Updates will be posted here.
Let’s assume the Coalition end up with a slim majority after all the votes are counted. I think this result is an opportunity to demonstrate the benefits of probabilistic forecasting. When the Buckley’s & None forecast gave a 1 in 4 chance of the Coalition winning that’s the same as flipping a coin twice and getting heads both times. Most of the time you flip a coin twice, you don’t get two heads, but some of the time (~25%) it does happen. As you’re reading this, grab a coin and flip it a few times to see what you get. This means our forecast was saying “There’s a real possibility the Coalition will win. It’s not the most likely outcome, but they definitely have more than a buckley’s (😉) chance of winning.”
Here’s another way to think about it: if there were 4 different elections that had similar polling to what we saw this election, we’d expect an upset result like this to occur at 1 of those 4 elections. With elections every 3 years in Australia, we’d expect something like this every 12 years or so. The last big polling error like this was in 2004, 15 years ago.
If the polling had favoured the ALP 54% to the Coalition 46%, the Buckley’s & None forecast might have given the Coalition a 5% chance of winning (just a guess). In that case, a Coalition victory would have been a huge surprise and should only happen once in 60 years. The point is, polling errors occur, swings aren’t uniform across the country and that means “unlikely” things happen. By using probabilistic forecasting we can get an idea of how likely they are.
A good comparison for probabilistic forecasts are betting odds which can be converted to implied probabilities. Here’s a table of the betting odds at about the same time I made the last update to the Buckley’s & None forecast.
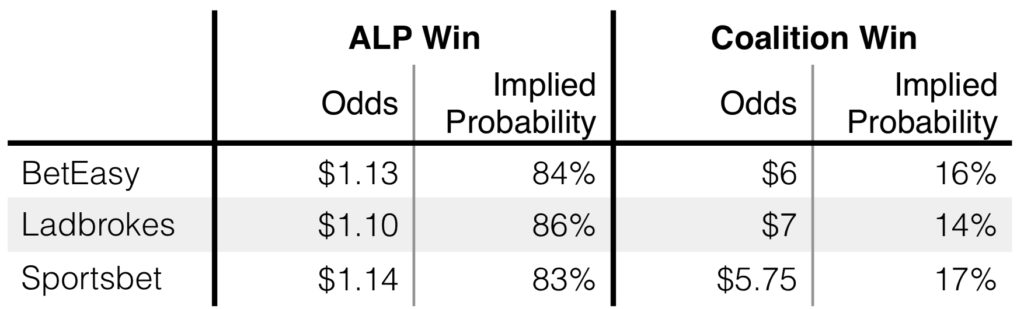
Thanks to Mark the Graph for putting these up here. We gave the coalition a 25.3% chance of winning a majority, substantial higher probability than all the betting markets.
I’m not trying to rewrite history or pretend we had the Coalition as favourites. We didn’t. However, we did give a higher probability to a Coalition victory than the betting markets. I think the result of this election shows the benefits of probabilistic forecasting. I built Buckley’s & None hoping that outcomes we give a 25% probability actually happen 1 in 4 times in the long run. It’s too early to tell if we’re well calibrated but I’m looking forward to making more predictions and keeping track of how we’re going.